10 Key Business Metrics (KPIs) to track for D2C Brands

Tracking the right D2C KPIs is the difference between scaling confidently and flying blind. For any direct-to-consumer brand competing in India's rapidly growing D2C landscape, knowing which D2C metrics to measure and how to act on them is what separates high-growth brands from those that plateau.
HRX, a popular Indian fitness and lifestyle brand that was launched in 2013 by Bollywood actor Hrithik Roshan has hit a revenue of 920 crore in 2023.
boAt is India's third most-funded D2C brand and the world's fifth largest wearables brand. It specialises in headphones, earphones, speakers and other audio accessories.
Sugar Cosmetics, founded by Vineeta Singh of Shark Tank fame and her husband Kaushik Mukherjee, is worth more than $500 million. It has over 2500 stores in 130 cities across India.
These numbers are a testament to the success of D2C retail model.
D2C brands are rapidly rising in India, with estimates indicating that the overall market size is $44.6 billion as of 2021 and is expected to grow past the $100-billion mark by 2025.
You can't chase revenues as a customer centric D2C brand unless you truly understand your customers' needs and preferences. Once you set the wheels in motion, you need to measure and track the KPIs for D2C Brands that matter.
Before we make the jump to key performance metrics for D2C brands, let us first decode the D2C retail model.

What is a D2C KPI and Why Does It Matter?
A D2C KPI (Key Performance Indicator) is a measurable value that helps direct-to-consumer brands evaluate how effectively they are achieving their business goals. Unlike traditional retail where intermediary's obscure customer data, D2C brands have direct access to rich customer behavior data ,making D2C metrics both more accessible and more actionable than in any other retail model.
D2C metrics serve as the fundamental building blocks for measuring campaign effectiveness, operational efficiency, customer loyalty, and long-term profitability. Whether you're a new D2C brand or an established player, selecting the right D2C KPIs and tracking them consistently is essential for making informed, growth-oriented decisions.
D2C Model is Turning Heads in Retail
A Direct-to-Consumer (D2C) retail model is a fast growing approach of selling products directly to customers, without relying on intermediaries or traditional retail channels. This model is disrupting the retail industry by providing consumers with a personalised and engaging shopping experience while empowering brands to have greater control over their product offerings and customer relationships.
D2C brands use a variety of tactics to reach consumers such as social media marketing, influencer collaborations and targeted digital advertising. They can create a strong brand identity and connect with their target audience in a more authentic and meaningful way by leveraging these channels

Ginesys One - Your seamless tech stack for Online and Offline retail
In addition to these benefits for consumers, D2C models offer many advantages for businesses as well. These include higher profit margins due to the elimination of middlemen, greater flexibility in product development and pricing strategies, and the ability to gather valuable customer data for future business decisions.
The D2C retail model is an exciting and rapidly growing space that is transforming the way businesses and consumers interact. By embracing this model, and tracking the right KPIs for D2C brands, D2C companies can open up new revenue streams, build stronger customer relationships, and drive long-term success in the competitive retail landscape.

The D2C Customer Funnel
The customer funnel for D2C retail brands are like the traditional customer funnel, with a few unique considerations due to the nature of the D2C model. Here's how the funnel can be broken down for a D2C brand:
Acquisition
The acquisition stage for D2C companies typically involves using digital marketing channels such as social media, influencer marketing and targeted ads to reach potential customers. D2C brands often rely heavily on social media platforms to build brand awareness and drive traffic to their website. In addition, they may also use content marketing, search engine optimization (SEO) and referral marketing to attract potential customers.
Conversion
The conversion stage for a D2C brand is all about making the buying process as easy and seamless as possible for customers. This may involve offering free shipping and returns, providing detailed product information and reviews, and using persuasive copywriting and visuals to showcase the benefits of the product. D2C brands may also use retargeting ads and email marketing to encourage customers to complete their purchase and offer incentives such as discounts or free gifts.
Retention
The retention stage for D2C companies is particularly important, as brands often rely on repeat purchases and customer loyalty to drive long-term success. D2C brands can use tactics such as personalized communication, loyalty programs and customer service to keep customers engaged and encourage repeat purchases. They can also use email marketing and social media to keep customers up to date on new products, promotions and other brand news.
The customer funnel for a D2C brand is similar to the traditional funnel, with greater focus on digital marketing channels and building strong customer relationships. By leveraging digital marketing tactics and focusing on providing a seamless customer experience, D2C brands can attract and retain loyal customers and drive long-term success.

10 top KPIs to Measure your D2C Brand Success
D2C brands have transformed the way products are sold, allowing companies to establish direct relationships with their customers and gain complete control over the customer experience. However, with the rise of the D2C model comes the challenge of accurately measuring success. D2C brands operate in a highly competitive and rapidly changing landscape, where it's essential to track the right KPIs for D2C brands to make informed business decisions.
To truly understand the performance of any brand campaign, marketers need to understand the value of metrics. KPIs or key performance indicators for D2C brands are the fundamental building blocks for measuring the effectiveness of D2C brands.
Whether you're a new D2C brand or an established player, these KPIs for D2C brands will help you stay ahead of the curve and achieve your goals. Let us explore these 10 business metrics for D2C brands across the customer funnel journey:
ACQUISITION STAGE
Customer Acquisition Cost- How much do I spend for every new customer?
Customer Acquisition Cost (CAC) is the average amount of money your company spends every time someone makes a purchase from you.
It is calculated by dividing the total cost of acquiring new customers (including marketing efforts, advertising, customer acquisition and sales costs) by the number of new customers acquired during a specific time-period.
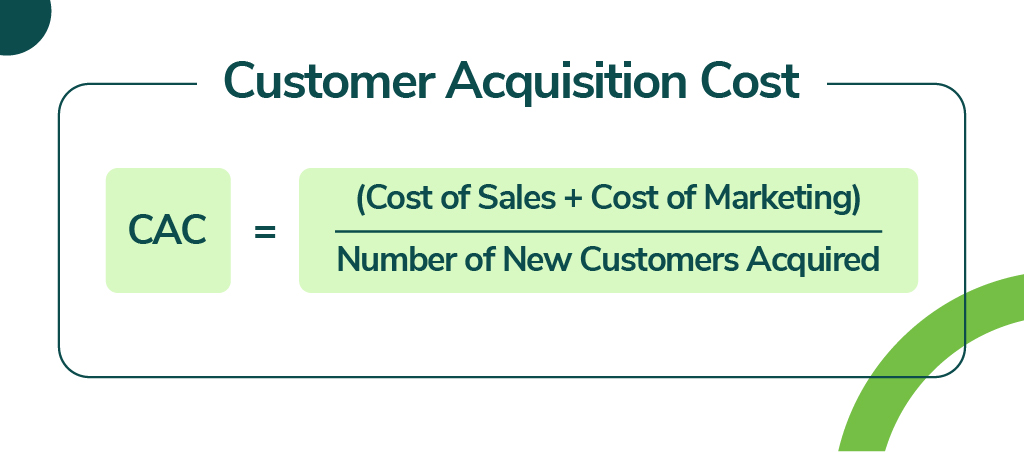
For example, if a company spends $10,000 on marketing campaigns and acquires 100 new customers during the same period, the CAC would be $100.
The CAC metric is essential for businesses to understand the effectiveness of their customer acquisition strategies and the return on investment (ROI) of their marketing efforts. A high CAC indicates that a business is spending too much money on customer acquisition and may need to optimize their marketing campaigns, improve targeting, or develop new acquisition channels. On the other hand, a low CAC suggests that a business is acquiring customers efficiently and can invest in scaling their acquisition efforts.

CONVERSION STAGE
Conversion Rate- How many customers actually make the purchase?
Conversion rate is one of the crucial tracking metrics for direct-to-consumer brands that measures the percentage of website visitors who take a specific action, such as making a purchase, filling out a form, or subscribing to a newsletter.
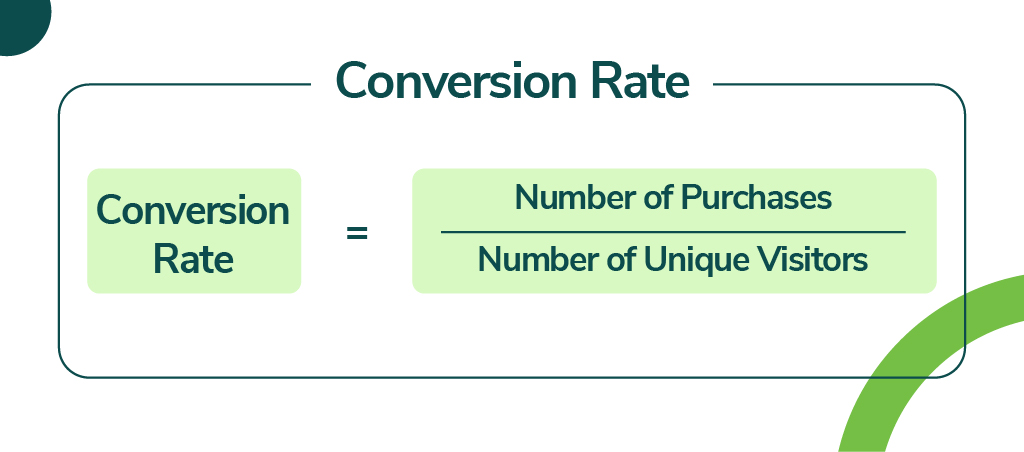
For instance, if a website receives 1,000 visitors and 50 of them make a purchase, the conversion rate would be 5%.
A higher conversion rate translates to more visitors taking the desired action, leading to higher sales and revenue. By tracking the conversion rate, D2C brands can identify areas of their website that need improvement, such as the checkout process, product pages, or landing pages.
Average Order Value – How much does my existing customer spend per order?
Average Order Value (AOV) is a KPI for D2C brands that represents the average amount of money spent by a customer for each order or transaction.
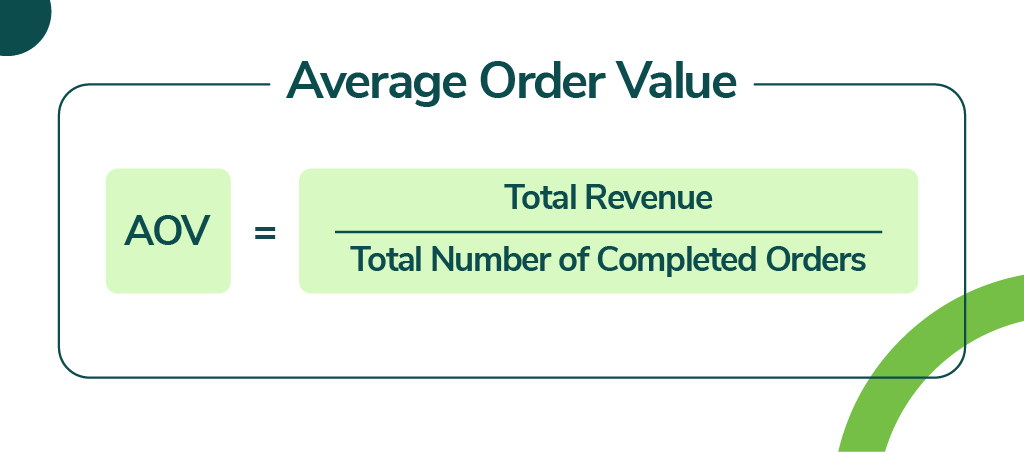
If a D2C brand generates $10,000 in revenue from 100 orders in a month, the AOV would be $100.
For instance, let us look at a loyal customer Peter. Peter usually checks out after making a purchase worth $100 on your website. The goal should be to encourage existing customers like Peter to spend around $200 by adjusting pricing strategies and offering incentives.
A higher AOV signifies that customers are spending more on each order. This can be achieved through various strategies such as upselling, bundling, offering discounts on multiple purchases, or setting minimum order values for free shipping.
Cart Abandonment Rate – How many customers abandon the shopping cart?
Cart Abandonment Rate (CAR) is a metric that measures the percentage of customers who add items to their online shopping cart but do not complete the purchase.

If a D2C brand has 100 shopping carts created but only 50 are completed, the CAR would be 50%.
CAR is important for a D2C brand because it can provide valuable insights into the reasons why customers are not completing their purchases. Common reasons for cart abandonment include unexpected shipping costs, a lengthy checkout process, lack of adequate payment options, security concerns, or simply being distracted while making the purchase.
Tracking CAR helps D2C brands identify key areas for improvement in their loyalty programs, checkout process or sales strategies. D2C brands can use retargeting techniques such as email reminders or personalized coupons to bring back customers who abandoned their carts and encourage them to complete their purchase.
Also Read: 7 Coupon Ideas for Retail Stores and How Retailers Grow Revenue on a Budget
Churn Rate- How many customers have been lost during a certain period?
Churn Rate is a metric that measures the percentage of customers who stopped using a product or service during a given time-period. .

For example, if a D2C brand had 100 customers in the beginning of the month and lost 10 customers during the same month, the churn rate would be 10%.
A high churn rate indicates that the brand is losing customers at a faster rate than it is acquiring new ones, which can negatively impact revenue and growth.
D2C brands can use churn rate as a benchmark to evaluate the effectiveness of their marketing and sales strategies. For instance, if a new marketing campaign leads to a higher churn rate, the brand can evaluate if the campaign attracted the wrong type of customer or if the messaging needs to be adjusted to align better with customer needs.

RETENTION STAGE METRICS
Customer Retention Rate (CRR)- How many customers have been retained over a specific time-period?
Customer Retention Rate (CRR) is one of the KPIs for D2C brands that measures the percentage of customers who continue to do business with a company over a certain period of time.
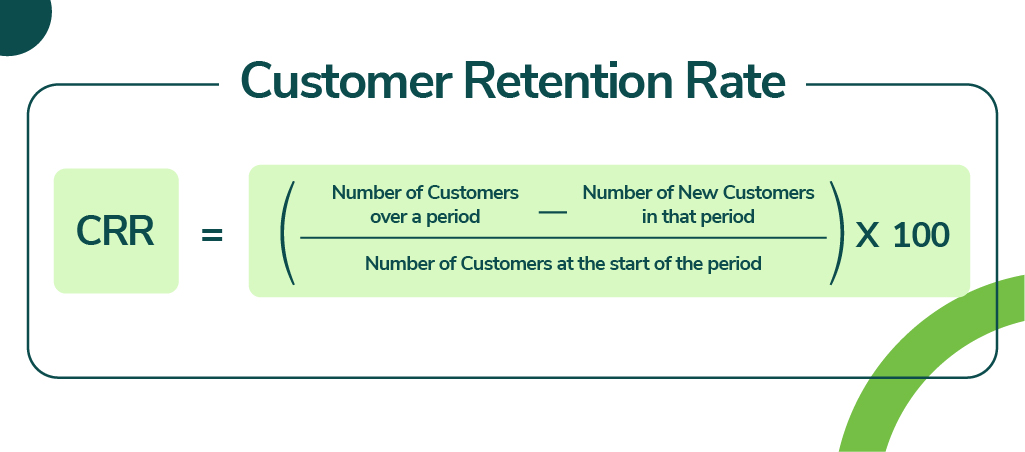
CRR is important for a D2C brand because it provides greater insights into the loyalty of its customer base.
Repeat Customer Rate (RCR)- How many customers make repeat purchases?
Repeat Customer Rate (RCR) is a metric that measures the percentage of customers who purchase from a company more than once over a given period.
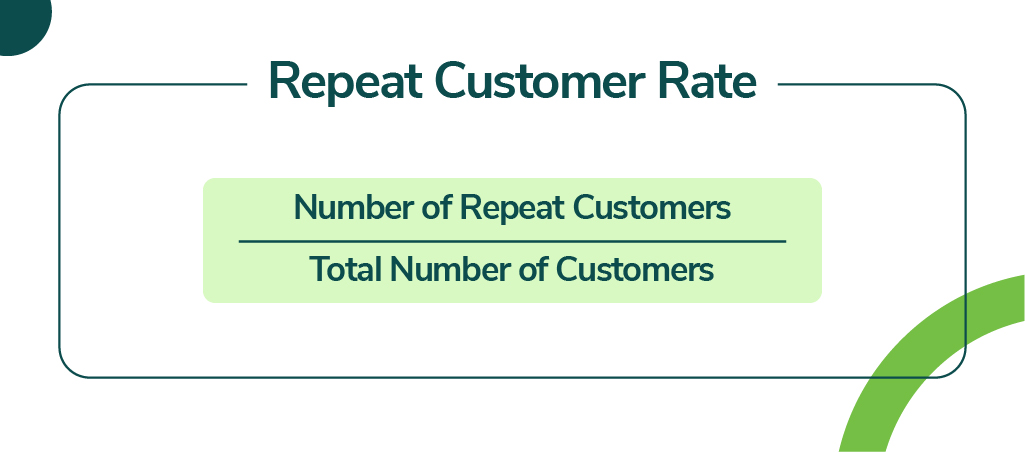
If a D2C brand had 100 customers and 30 of them made more than one purchase, the RCR would be 30%.
Higher RCR indicates the likelihood of repeat business. These loyal customers are more likely to spend more and make larger purchases over time. Repeat customers eventually become brand advocates, recommending the brand to others and helping attract new customers.

REVENUE PARAMETERS
Customer Lifetime Value (CLV)- What is the total revenue a customer generates over his life journey?
Customer Lifetime Value (CLV) is one of the business metrics for D2C brands that measures the total amount of revenue a customer is expected to generate for a company over the course of their relationship. It takes into account factors such as purchase history, frequency of purchases and customer retention rate.
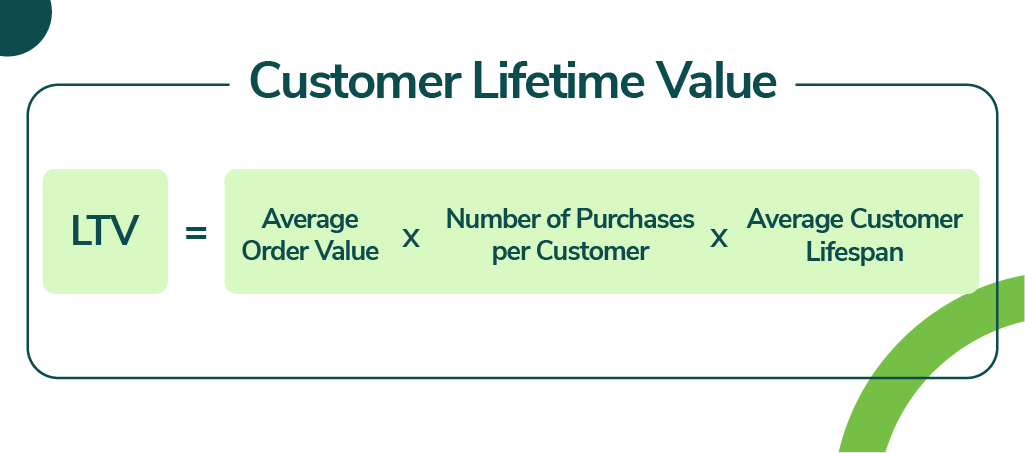
CLV is important for a D2C brand because it provides insights into the long-term value of its customers. By calculating the CLV, D2C brands can identify their most valuable customers and tailor their marketing and customer service efforts accordingly.
Product Margin- What is the Profit Margin for a particular product?
Product margin is a key financial metric that measures the profitability of individual products sold by a D2C brand. It is calculated by subtracting the cost of the product from the revenue generated by its sale and dividing the result by the revenue. The resulting percentage represents the profit margin for that product.
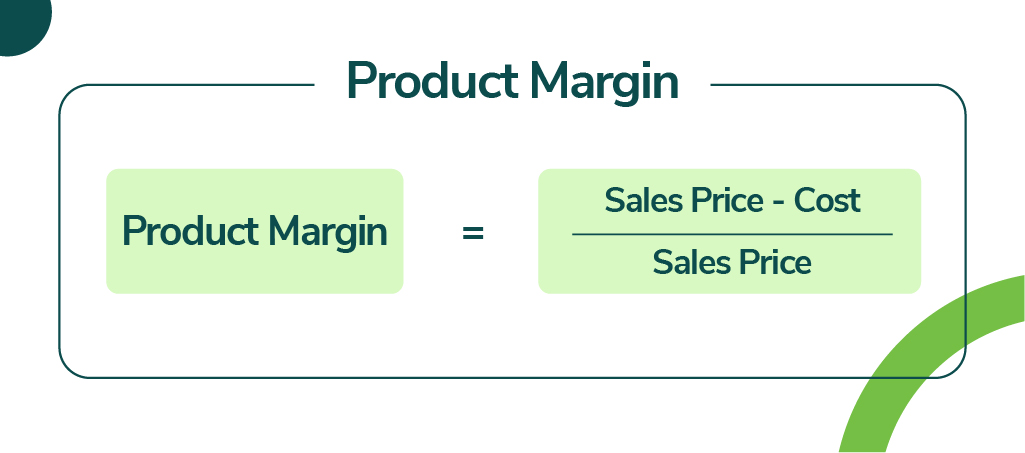
Product margin is crucial for D2C brands as it provides insights into the profitability of their products, allowing them to evaluate pricing strategies and make informed decisions about product development and sourcing. If a product has a higher profit margin, it may be worth investing in marketing and promotion efforts to increase sales, while products with lower margins may require pricing adjustments or sourcing to improve profitability.
Net Revenue Retention- How much revenue has been retained from repeat buyers?
Net Revenue Retention (NRR) is one of the KPIs for D2C brands that measures a company's ability to keep and grow revenue from existing customers over a given period. Having a high NRR means the brand is successful in retaining and growing revenue from existing customers, reducing the need for expensive customer acquisition efforts. NRR can also help identify areas for improvement in customer experience and retention strategies.

MRR: Monthly Recurring Revenue
Expansion MRR: Customers upgrading to higher tiers, purchasing new products (upselling, cross selling, price increases)
Contraction MRR: Customers downgrading plan (cancellations, non-renewals)
Churn MRR: Customers not using the product anymore (lost customers)

In conclusion, tracking D2C business metrics or KPIs for D2C brands is crucial for the success of D2C businesses. By monitoring these metrics, businesses can gain valuable insights into their performance and make data-driven decisions to drive growth and optimize strategies. Here, we have explored ten essential D2C brand performance indicators that every D2C company should track.
From revenue and customer acquisition cost to customer lifetime value and conversion rates, each KPI for D2C brands plays a vital role in evaluating the effectiveness of marketing campaigns, operational efficiency, and overall business performance. By carefully monitoring and analyzing these D2C business metrics, D2C brands can identify areas for improvement, capitalize on growth opportunities, and stay ahead in a competitive market.
Remember, every D2C brand is unique, and it is essential to choose metrics and KPIs for D2C brands that align with your specific business goals and objectives. Regularly tracking and analyzing these KPIs for D2C brands will help you stay informed, make informed decisions, and continuously optimize your strategies to drive success in the dynamic world of D2C.
Implementing a robust D2C brand analytics and reporting system, leveraging technology solutions, and staying up-to-date with industry trends are essential for effectively tracking and understanding these key metrics. By doing so, D2C brands can unlock their full potential, achieve sustainable growth, and deliver exceptional customer experiences.
Stay tuned to the Ginesys Blog for more valuable insights, strategies, and best practices to help you navigate the evolving landscape of D2C brands and thrive in the digital age.
Scale your D2C Brand with Ginesys
If you are looking to scale your D2C brand and take your business to the next level, Ginesys is the solution for you. Ginesys' seamless omnichannel platform helps you provide a seamless shopping experience for your customers across all channels, helping you increase customer satisfaction and loyalty.
Our eCommerce development solution helps you create and manage your own online store through features such as product catalogs, shopping carts, and payment gateways, helping you reach a wider audience and generate more revenue. Our omnichannel solution Ginesys One that is a deep integration of the OMS the ERP and POS helps you sell online with a smaller inventory pool, helping you save costs.
Our ERP and BI tools help track all transactions and analyze data in a few clicks. This means that the above KPIs for D2C brands are available at your fingertips no matter the scale of your operations. Leverage Ginesys’ solutions to scale your D2C brand, drive long-term growth, and stay ahead of the competition.
Scale your D2C brand with Ginesys. Ask for a Demo.